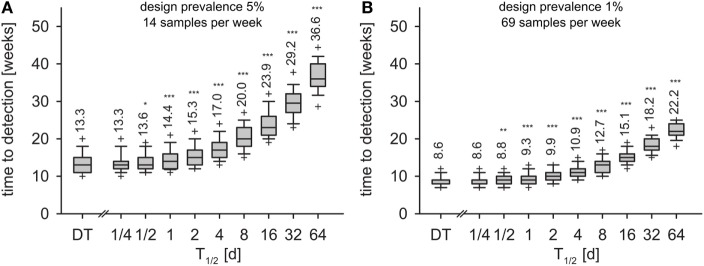
Figure 6.
Time to detection for monthly design prevalence of 5% (A) and 1% (B) for the DT model and for the IT model with different pathogen half-life. Outlier symbols (+) show 5 and 95% quantiles. Text shows geometric means. Asterisks show significance of Mann–Whitney U test against DT model (H0: not greater than DT; *p < 0.05, **p < 0.01, ***p < 0.001).

