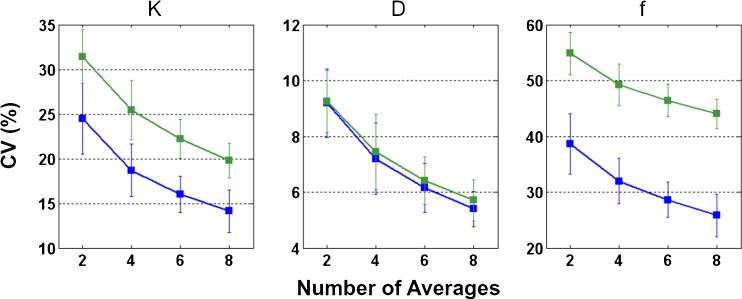
Fig. 2.
Estimate variability of the diffusion kurtosis coefficient (K), diffusion coefficient (D) and blood volume fraction (f). On a per-subject basis, bootstrap was performed for a varied number of averages (2, 4, 6 and 8). Coefficient of variation (CV) was computed as a measure of variability. Grey matter (blue lines) and white matter (green lines) are shown separately. The error bars indicate the standard deviation across 15 healthy volunteers

