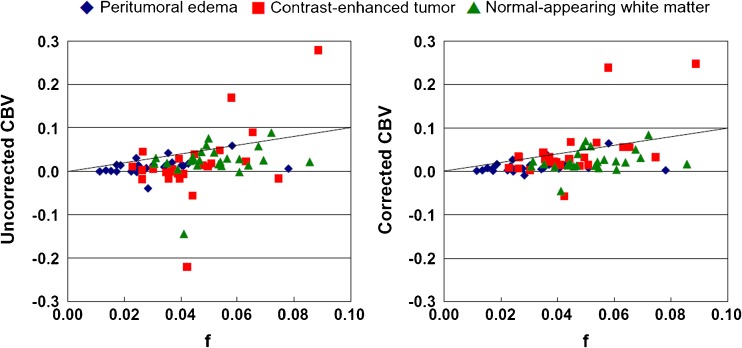
Fig. 4.
Comparison between blood volume fraction (f) and cerebral blood volume derived from dynamic susceptibility contrast imaging (CBVDSC) in 30 patients. Contrast-enhanced tumours, peritumoral oedema and normal-appearing white matter are indicated by red squares, blue diamonds and green triangles, respectively. A larger scale is used for CBVDSC to accommodate the negative values before correction. Identity lines are shown

