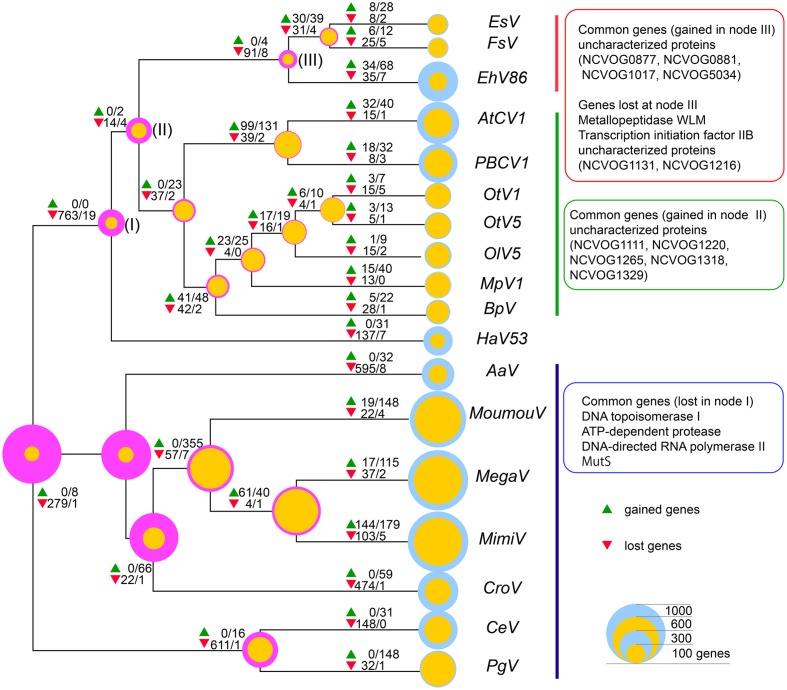
FIGURE 5.
Inferred gene gain/loss patterns and NCLDV hallmark genes. Numbers of genes gained (green triangles) and lost (red triangles) inferred using COUNT implementing Wagner parsimony are indicated at each node. The former and the latter numbers, separated by slashes, indicated at the symbols are numbers of gained or lost genes inferred by the analysis with gain penalties 5 and 1, respectively. Magenta and yellow circles at the nodes indicate inferred NCVOGs numbers with gain penalties 5 and 1, respectively, and blue circles indicate numbers of genes of each analyzed virus. Sizes of the circles represent numbers of genes.

