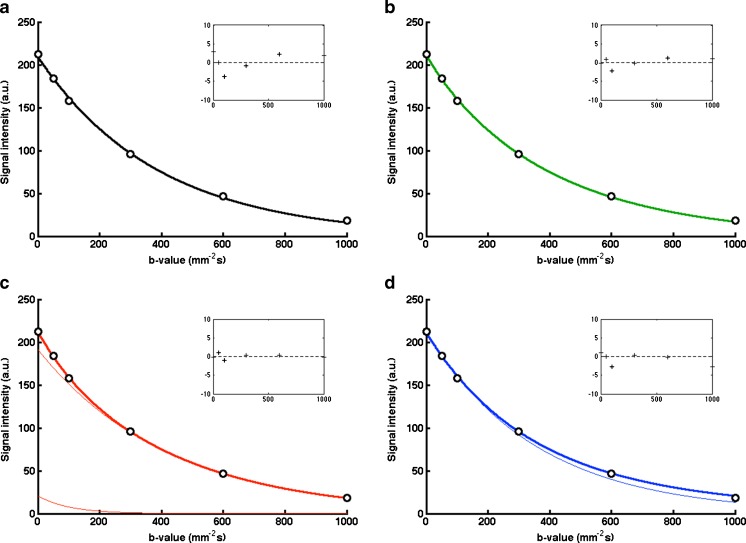
Fig. 2.
Example plots of diffusion models of data from a single tumour voxel from patient in Fig. 1, using a monoexponential, b stretched exponential, c IVIM, and d kurtosis models. Narrow lines show c the slow and fast components of the model, and d the first term in the kurtosis model (DDCK). Residuals for the fitting are shown inset (units as main axes)

