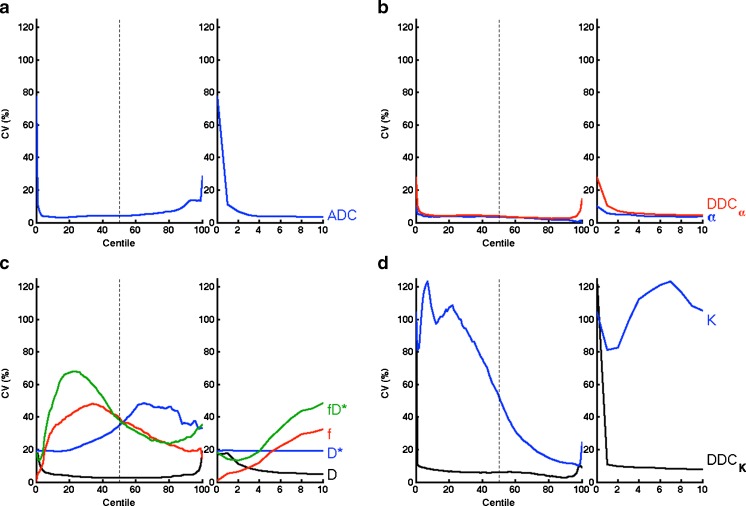
Fig. 3.
Plots of CV at each centile of the histograms for each parameter in the a monoexponential, b stretched exponential, c IVIM, and d kurtosis diffusion models. The diffusion-related parameters exhibit low CV as low as 5th percentile (expanded sections), but large variability is observed for perfusion- and kurtosis-related parameters

