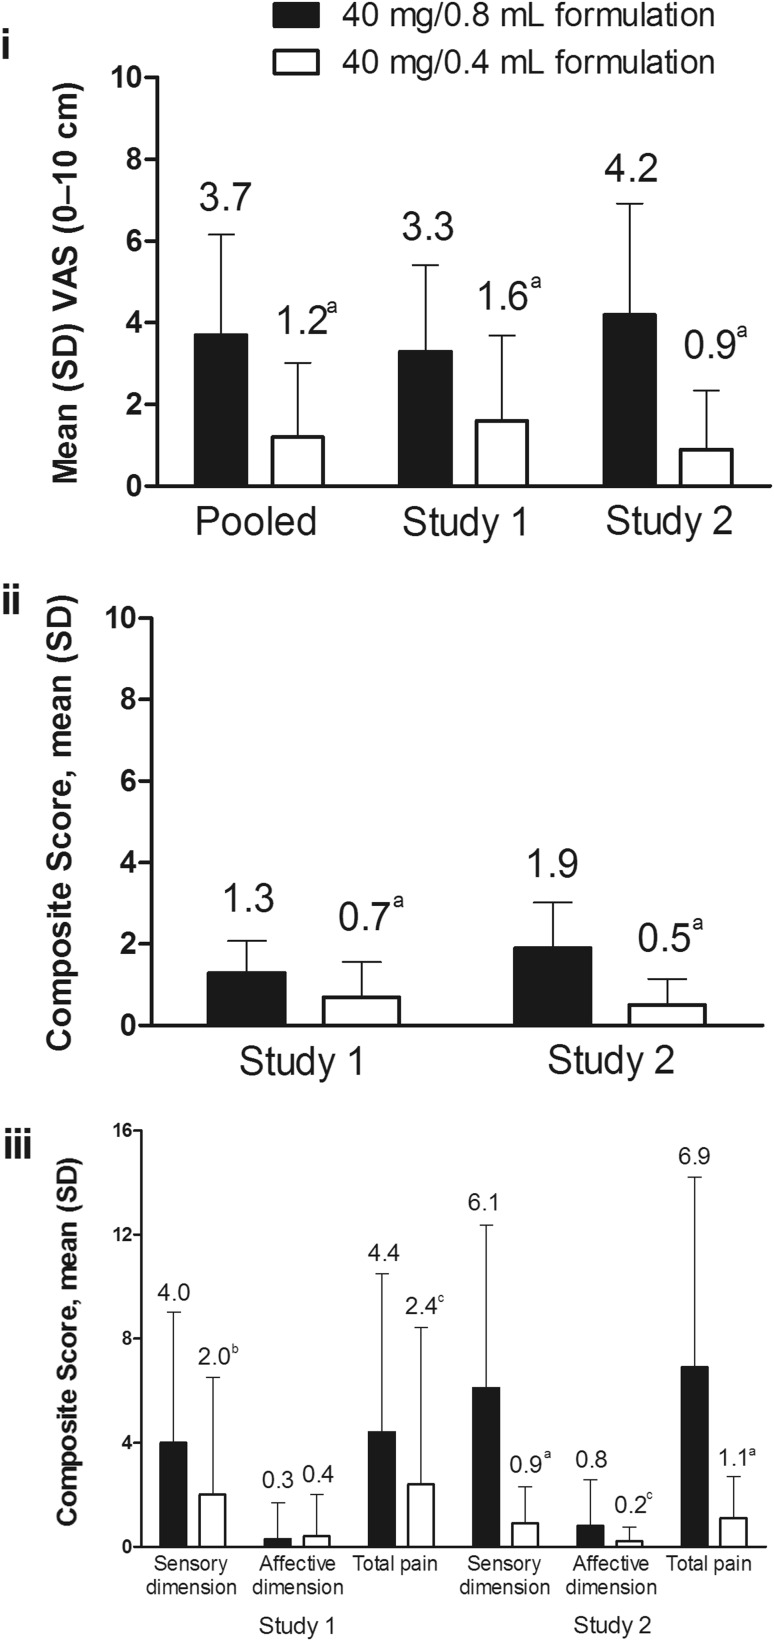
Fig. 3.
Parameters assessed in the cITT population immediately after injection. Injection site pain for pooled data, Study 1, and Study 2 (i); present pain intensity in Study 1 and Study 2 (ii); and MPQ-SF total pain, sensory dimension, and affective dimension scores of pain experience scores in Study 1 and Study 2 (iii). cITT crossover intent-to-treat, MPQ-SF short-form McGill Pain Questionnaire, SD standard deviation, VAS visual analog scale. a P < 0.001. b P = 0.001. c P = 0.009

