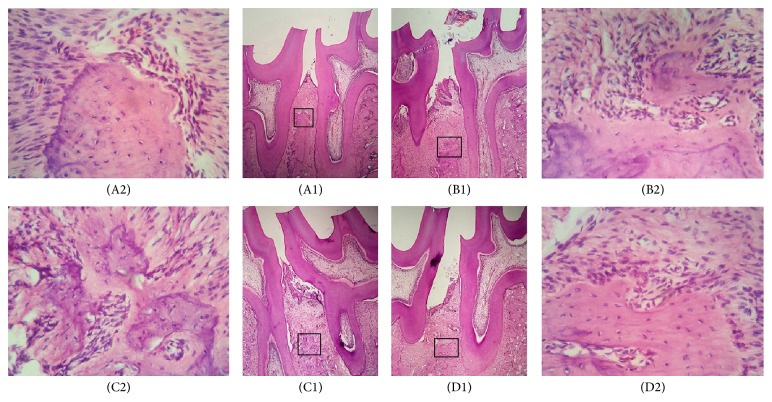
Figure 3.
Photomicrographs of bone tissue in the alveolar bone area between the first and second maxillary molars with induced periodontitis. Notes: (A1) SDT group at 10 days. (A2) Areas of thick bone trabecula without signs of resorption in the SDT group at 10 days. (B1) Control 1 group at 10 days. (B2) Areas of bone resorption with thin bone trabecula and disorganized connective tissue in the control 1 group at 10 days. (C1) Control 2 group at 10 days. (C2) Areas of bone resorption with thin bone trabecula and disorganized connective tissue in the control 2 group at 10 days. (D1) Control 3 group at 10 days. (D2) Areas of bone resorption with thin bone trabecula and disorganized connective tissue in the control 3 group at 10 days. Hematoxylin and eosin staining; original magnification for (A1), (B1), (C1), and (D1) was ×4 and for (A2), (B2), (C2), and (D2) was ×40.

