Figure 1.

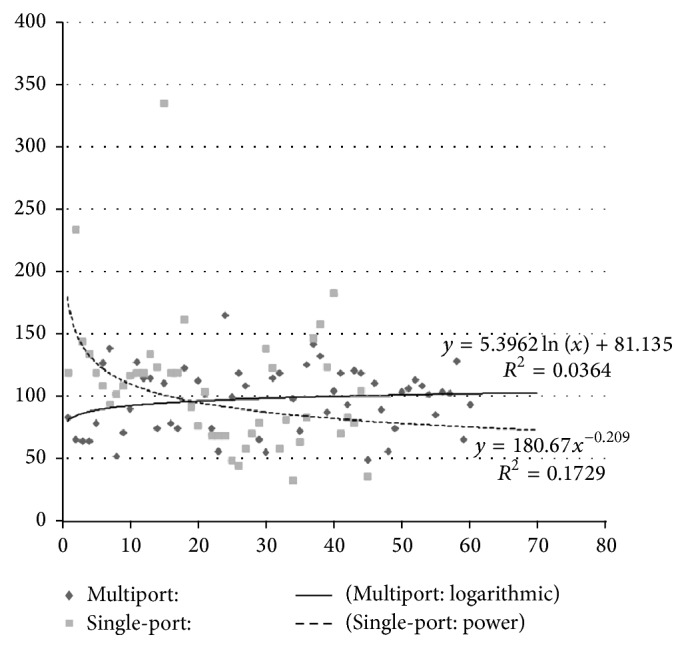
The fitting curves and the trend of operative times among patients of the 2 groups (x-axis represents the cumulative number of cases and y-axis represents the operative time (minutes)). There is a trend of shorter operative time among the later patients of the single-port group (the single-port curve best fits the power function), whereas the trend of operative time changes among the multiport group is more flat (the multiport curve best fits the logarithmic function).
