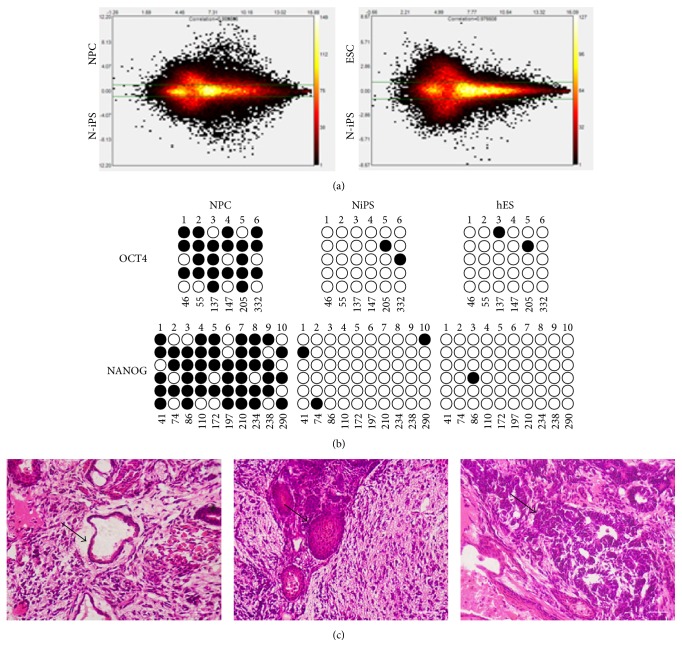
Figure 3.
Analyses of DNA methylation and gene expression profiling in NiPS, NPC, and hES cells. (a) Analysis of gene expression profiling: the MvA plot is a comparison plot comparing two microarrays. The y-axis is displayed on a log2 scale with green threshold lines for two-fold changes. The lower parts of MvA plot represent signals of NiPS cells, while the upper parts represent signals of NPC or hES cells. The color coding of the plot indicates the density of probes represented by that data point; (b) bisulphite sequencing analysis of OCT4 and NANOG promoter regions in human NSCs, 1F-OCT4 human NiPS clones, and human ES cells; (c) Hematoxylin and Eosin (HE) stain of teratomas generated from 1F-OCT4 derived iPS cells injected subcutaneously into immunocompromised SCID mice. Structures derivative of all three germ layers could be identified. (i) Neural tissue (ectoderm, left), (ii) cartilage (mesoderm, middle), and (iii) gut-like epithelium (endoderm, right).

