Figure 9.

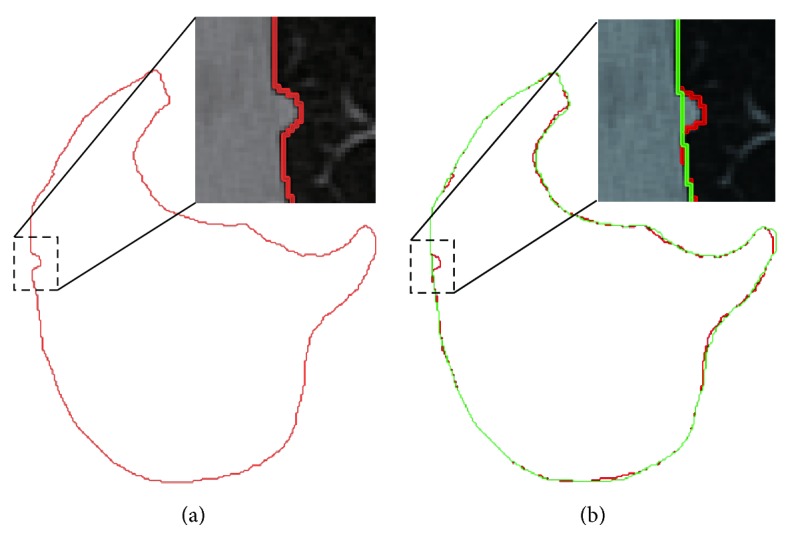
Illustration of border correction. (a) Undersegmentation. (b) After border correction Red line denotes the rough segmentation, while green line represents the effect of correction.

Illustration of border correction. (a) Undersegmentation. (b) After border correction Red line denotes the rough segmentation, while green line represents the effect of correction.