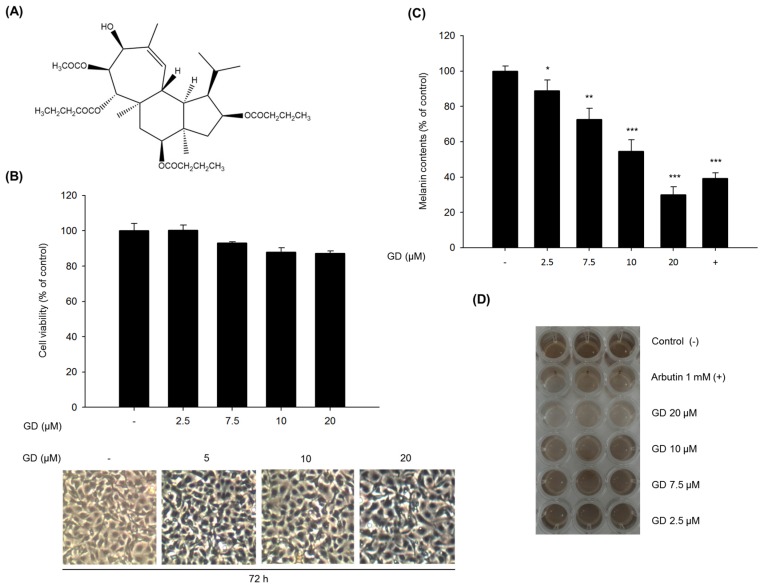
Figure 1.
Effects of GD on melanogenesis in melan-a cells. (A) The chemical structure of GD; (B) Cell viability was determined by MTT assay with the indicated concentrations of GD for 72 h, and the cellular morphology was observed under a phase-contrast microscope (at 100× magnification); (C) Inhibition of melanin biosynthesis in melan-a cells treated with the indicated concentrations of GD for 72 h. Arbutin (1 mM) was used as a positive control; (D) Macroscopic views of the results of (C). Data are shown as the mean ± standard deviation. * P < 0.05, ** P < 0.01, *** P < 0.001 are considered statistically significant compared to the control group.

