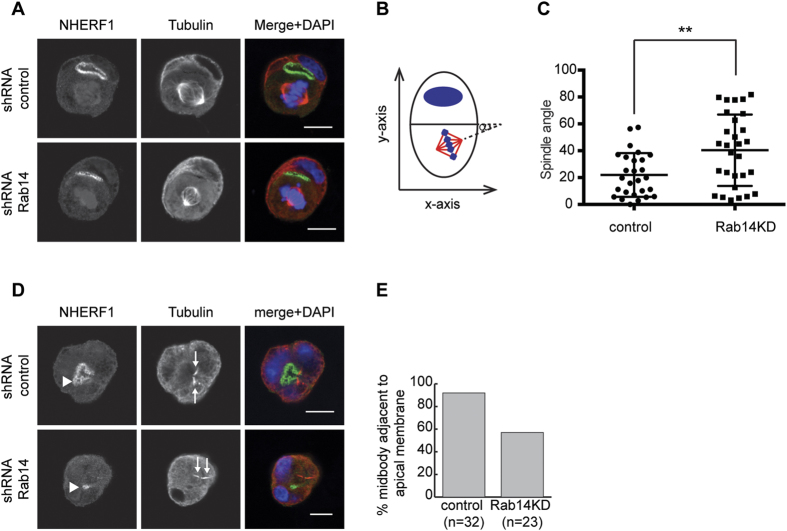
Figure 6. Rab14 KD results in random spindle angle and midbody position during mitosis.
(A) Cells pairs were labeled with antibodies against NHERF1 and tubulin and spindle angle of cell pairs was analyzed. (B) Diagram depicting how spindle angle was measured. (C) Quantification of spindle angles. In control pairs, the average spindle angle is 22°. Rab14 KD results in a random distribution with an average near 45°. (D) Cell pairs were labeled with NHERF1 (green) and tubulin (red). The position of the midbody (arrows) relative to the apical membrane labeled by NHERF1 (arrowheads) was analyzed. (E) Quantification shows the percentage of pairs with the midbody next to apical the membrane. Rab14 KD results in misplacement of the midbody. Scale bars, 10 μm.

