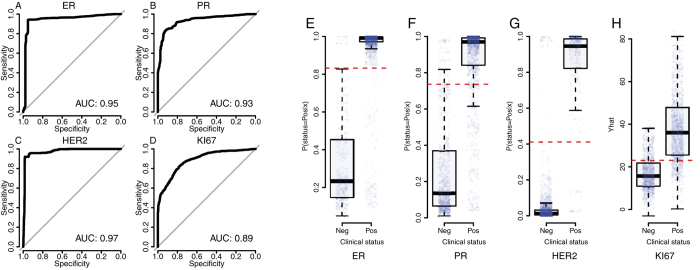
Figure 1.
Classification performance of RNAseq-based prediction models for ER, PR, HER2 and Ki-67 as indicated by Receiver operating characteristic curves based on cross-validation for (A) ER, (B) PR, (C) HER2, (D) Ki-67. Boxplots of p(status = positive | RNAseq profile) (the probability of positive status of the marker (ER, PR or HER2) given the RNAseq expression profile data) from cross-validation for (E) ER, (F) PR, (G) HER2 and (H) predicted ( ) Ki-67 score (% positively stained cells) given RNAseq expression profile data. Dotted red lines indicate optimal decision boundaries as determined by ROC analyses, corresponding to the point on the ROC curve with minimal distance to the top-left corner.

