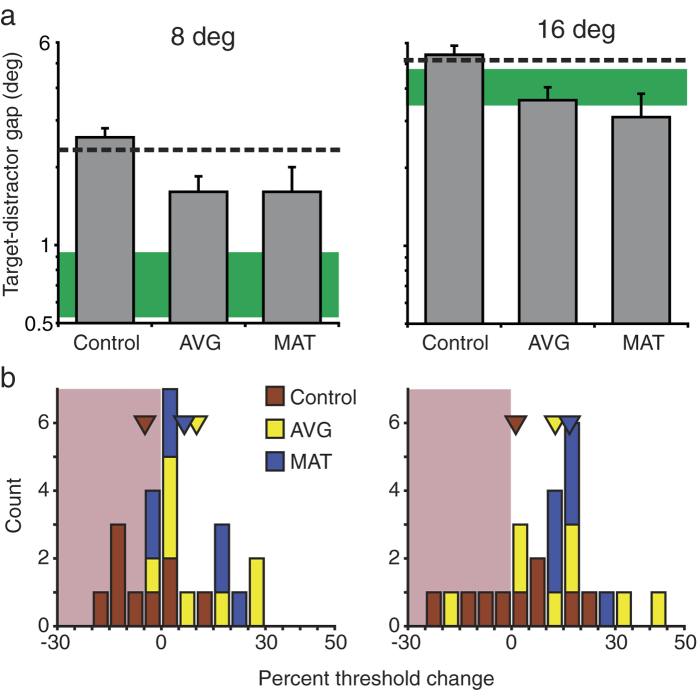
Figure 4. Effects of training on visual crowding.
(a) Estimated post-training thresholds for three training groups (grey bars). All conventions are as described in the Fig. 1 legend. (b) Distribution of threshold changes from pre to post-training for individual participants from three training groups. Positive numbers indicate improvements. Triangles show mean results for three training groups.

