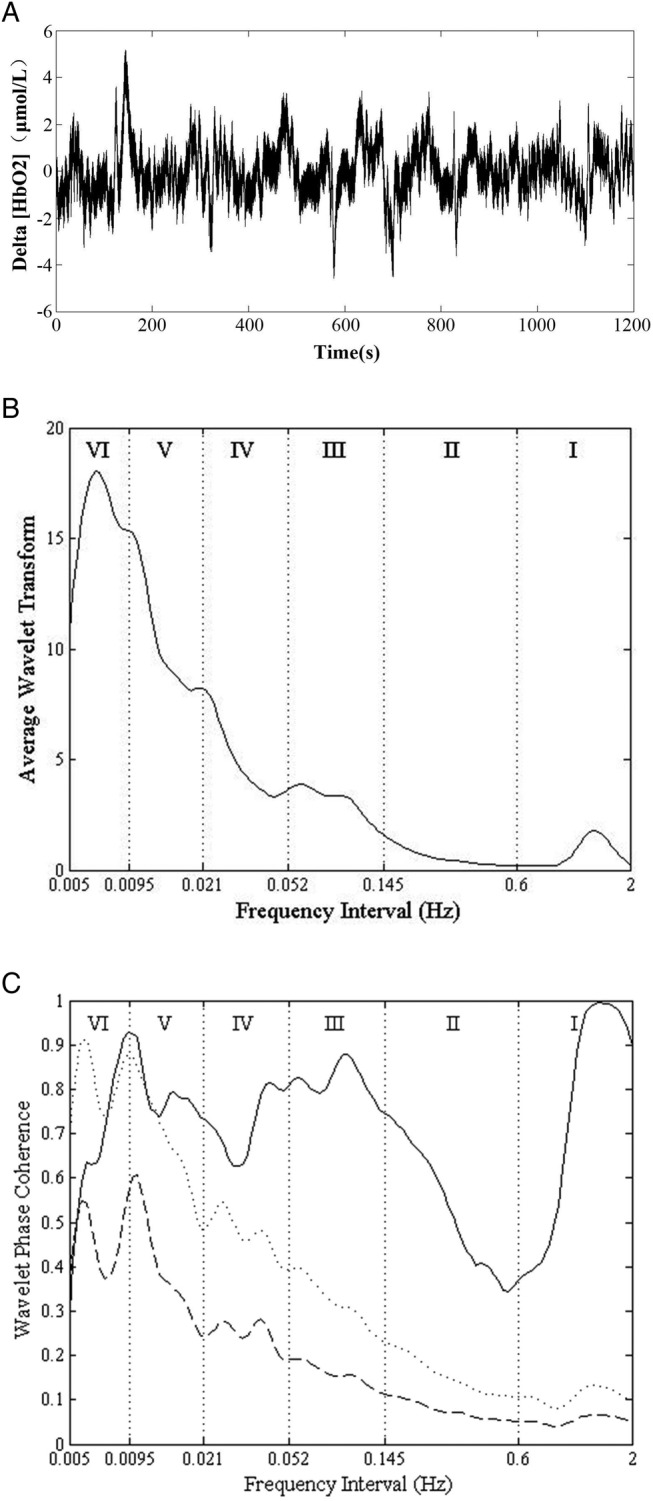
Figure 1.

(A) The Delta (HbO2) signal, (B) the wavelet amplitude (WA). The vertical lines indicate the outer limits of the frequency intervals: (I, 0.6–2 Hz; II, 0.145–0.6 Hz; III, 0.052–0.145 Hz; IV, 0.021–0.052 Hz; V, 0.0095–0.021 Hz; and VI, 0.005–0.0095 Hz). (C) Wavelet phase coherence of two Delta (HbO2) signals. The solid line shows the wavelet phase coherence of two Delta (HbO2) signals. The dashed line and the dotted line show the mean and two SDs above the mean for the coherence calculated from 100 amplitude-adjusted Fourier transform (AAFT) surrogate signals, respectively.
