Figure 2.

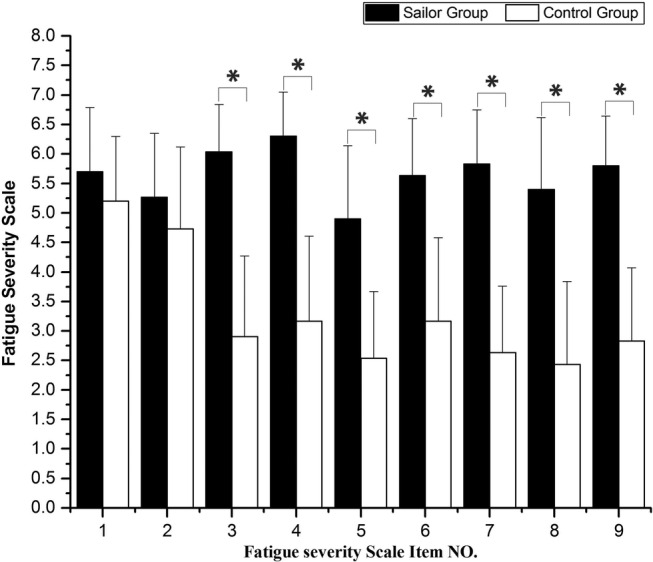
Comparison of fatigue severity scale (FSS) between the sailor group and control group. Significant differences are marked with *p<0.05 between the sailors and the age-matched controls.

Comparison of fatigue severity scale (FSS) between the sailor group and control group. Significant differences are marked with *p<0.05 between the sailors and the age-matched controls.