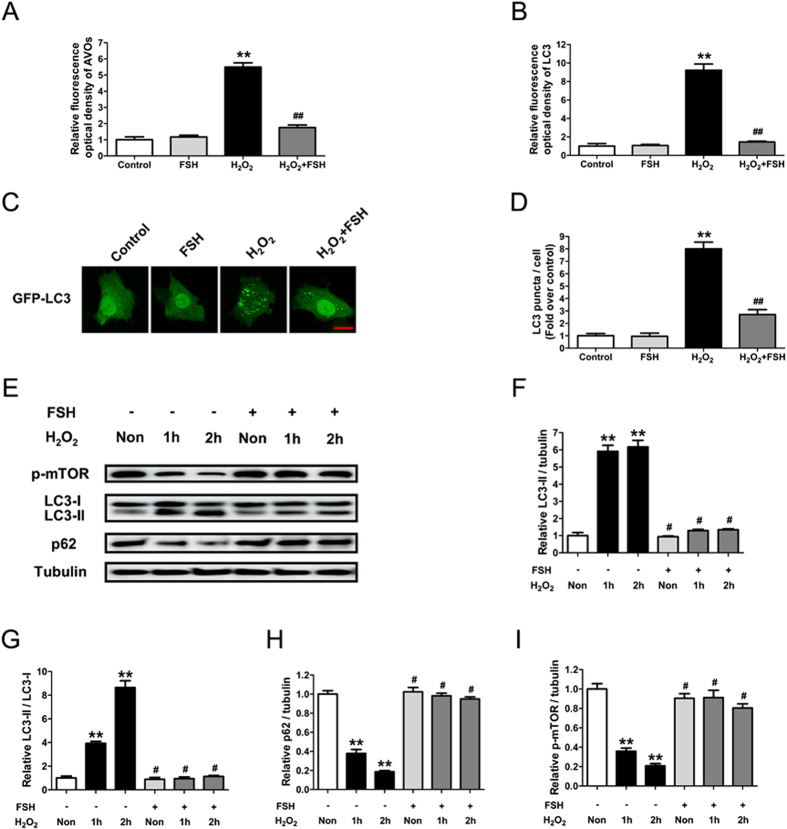
Figure 1. FSH reduced autophagy in GCs upon oxidative stress.
Primary cultured GCs with 1 h of H2O2 incubation (200 μM) were treated with 7.5 IU/ml FSH for 2 h. The acidic autophagic vacuoles were detected using acridine orange staining, and the LC3 protein was counterstained with anti-LC3. The formation of autophagic vacuoles was quantified by calculating the optical density of AVOs (A) and LC3 (B) per cell. Data represent mean ± S.E; n = 3 in each group. **Represents P < 0.01 compared to control group. ##Represents P < 0.01 compared to H2O2 group. (C) GCs transfected with GFP-LC3 plasmid for 48 h were incubated with 200 μM H2O2 for 1 h and cultured for another 2 h in the presence of 7.5 IU/ml FSH. Laser confocal-scanning microscopy was employed to observe the GFP fluorescent puncta in GCs. Bar, 10 μm. (D) Quantification of the GFP-LC3 puncta per cell. Experiments were repeated in triplicate, and three fields of each coverslip were selected in random for counting. Data represent mean ± S.E; n = 3. **P < 0.01 vs. control group; ##P < 0.01 vs. H2O2 group. (E) GCs incubated with or without 200 μM H2O2 for 1 h were then treated with FSH for 1–2 h. The expression of LC3, p62, and p-mTOR in GCs was determined by western blotting. (F–I) Quantification of LC3-II expression, conversion of LC3-I to LC3-II, p62 degradation and mTOR dephosphorylation. α-tubulin served as the control for loading. Data represent mean ± S.E; n = 3. **Represents P < 0.01 compared to control group. #Represents P > 0.05 compared to control group.

