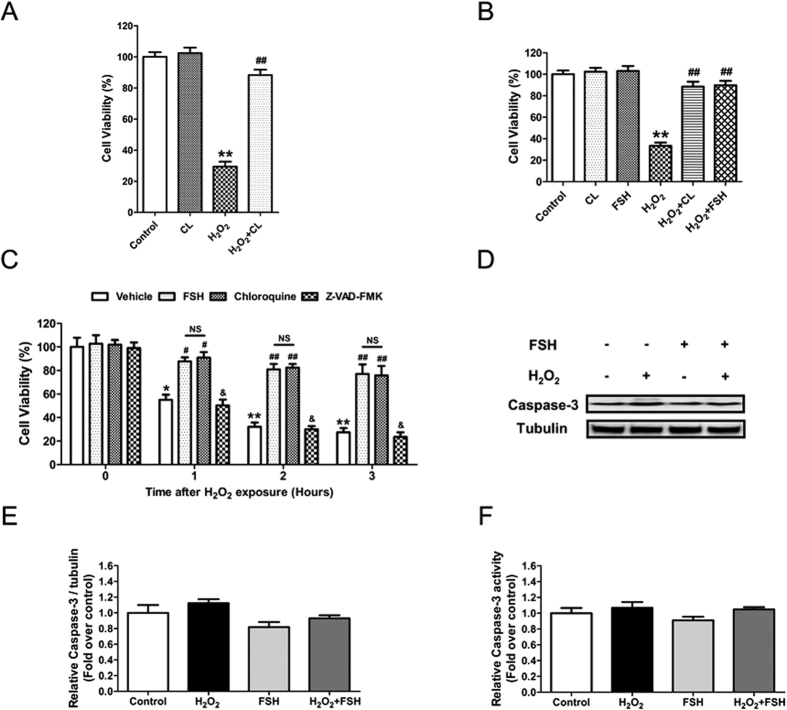
Figure 2. FSH prevented GCs from oxidative injury by inhibiting autophagy.
(A) Primary cultured GCs with 1 h of H2O2 incubation (200 μM) were treated with 50 μM chloroquine for 2 h, and cell viability was determined using the CCK-8 assay. Data represent mean ± S.E; n = 3. P** < 0.01 compared with control group. p## < 0.01 compared with H2O2-only-treated cells. CL, Chloroquine. (B) GCs were exposed to 200 μM H2O2 for 1 h, and then treated with 50 μM chloroquine or 7.5 IU/ml FSH for 2 h. Cell viability was measured by CCK-8 assay. Data represent mean ± S.E; n = 3 in each group. P** < 0.01 compared with control group. p## < 0.01 compared with H2O2-only-treated cells. (C) GCs incubated with 200 μM H2O2 for 1 h were treated with 7.5 IU/ml FSH, 50 μM chloroquine, or 50 μM Z-VAD-FMK. 0, 1, 2 or 3 h later, cell viability was detected using the CCK-8 assay. Data represent mean ± S.E; n = 3. *Represents P < 0.05 compared to vehicle group at 0 h. **Represents P < 0.01 compared to vehicle group at 0 h. #Represents P < 0.05 compared to H2O2-only-treated cells. ##Represents P < 0.01 compared to H2O2-only-treated cells. &Represents P > 0.05 compared to H2O2-only-treated cells. NS, not significant, P > 0.05. (D) GCs incubated with 200 μM H2O2 for 1 h were then treated with or without FSH for 2 h. The expression of caspase-3 in GCs was determined by western blotting. α-tubulin served as the control for loading. (E) Quantification of relative caspase-3 protein levels using densitometric analysis. Data represent mean ± S.E; n = 3. (F) The detection of caspase-3 activity in GCs with the indicated treatments. Data represent mean ± S.E; n = 3.

