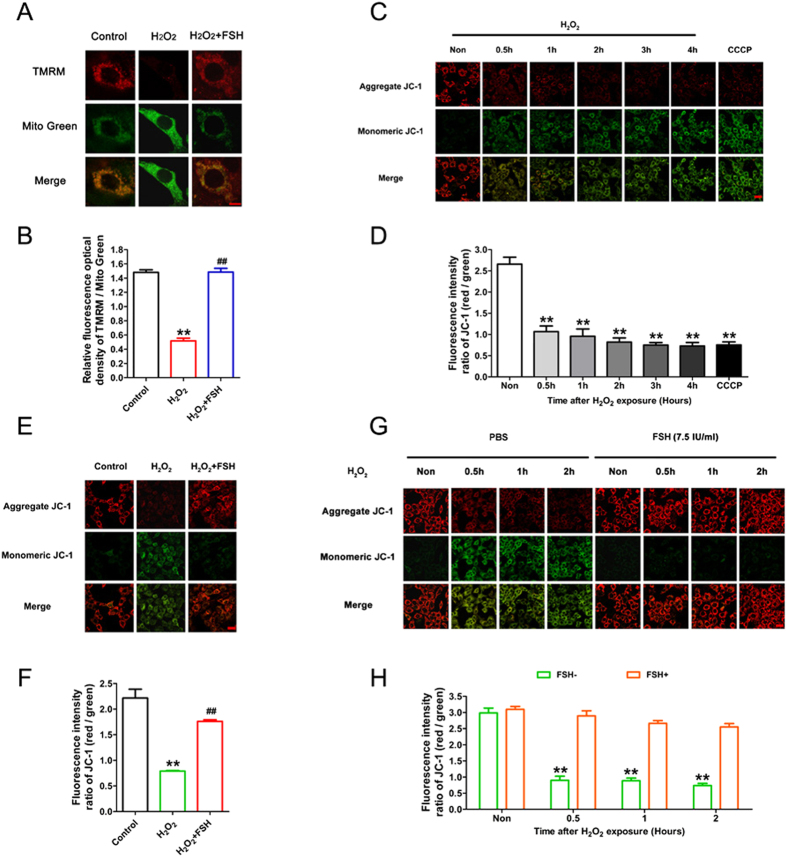
Figure 3. FSH maintained mitochondrial integrity in GCs subjected to oxidative stress.
(A) GCs harvested from dominant follicles were exposed to 200 μM H2O2 for 1 h, and then treated with 7.5 IU/ml FSH for 2 h. Mitochondria were double-stained with TMRM (red) and Mito Green (green), and observed using laser confocal-scanning microscopy. Bar, 10 μm. (B) Mitochondrial membrane potential (Δψm) was evaluated by calculating the relative fluorescence intensity of TMRM/Mito green. Data represent mean ± S.E; n = 3. Significances were marked as **P < 0.01 vs. control group; ##P < 0.01 vs. H2O2 group. (C) GCs incubated with 200 μM H2O2 for 1 h were cultured in DMEM/F-12 medium for another 0–4 h before collection. Cells were then stained with JC-1 to visualize the healthy mitochondria (uptaking red fluorescent aggregates of JC-1) and defective mitochondria (uptaking green fluorescent monomeric JC-1). The treatment of cells with 50 mM CCCP for 20 min was used as a positive control. Bar, 20 μm. (D) The fraction of depolarized mitochondria was evaluated by measuring the fluorescence intensity of aggregate JC-1/monomeric JC-1. Data represent mean ± S.E; n = 3. P** < 0.01 compared with control group (0 h group). (E) JC-1 staining image of GCs treated with 7.5 IU/ml FSH for 3 h following 1 h of H2O2 (200 μM) incubation. Bar, 20 μm. (F) The quantitative fluorescence intensity of aggregate JC-1/monomeric JC-1 as shown in (E). Data represent mean ± S.E; n = 3. P** < 0.01 compared with control group. p## < 0.01 compared with H2O2-only-treated cells. (G) GCs incubated with or without 200 μM H2O2 for 1 h were then treated with FSH for 0.5–2 h. Cells were collected for JC-1 staining. Bar, 20 μm. (H) The quantitative fluorescence optical density of aggregate JC-1/monomeric JC-1 as shown in (G). Data represent mean ± S.E; n = 3. P** < 0.01 compared with control group.

