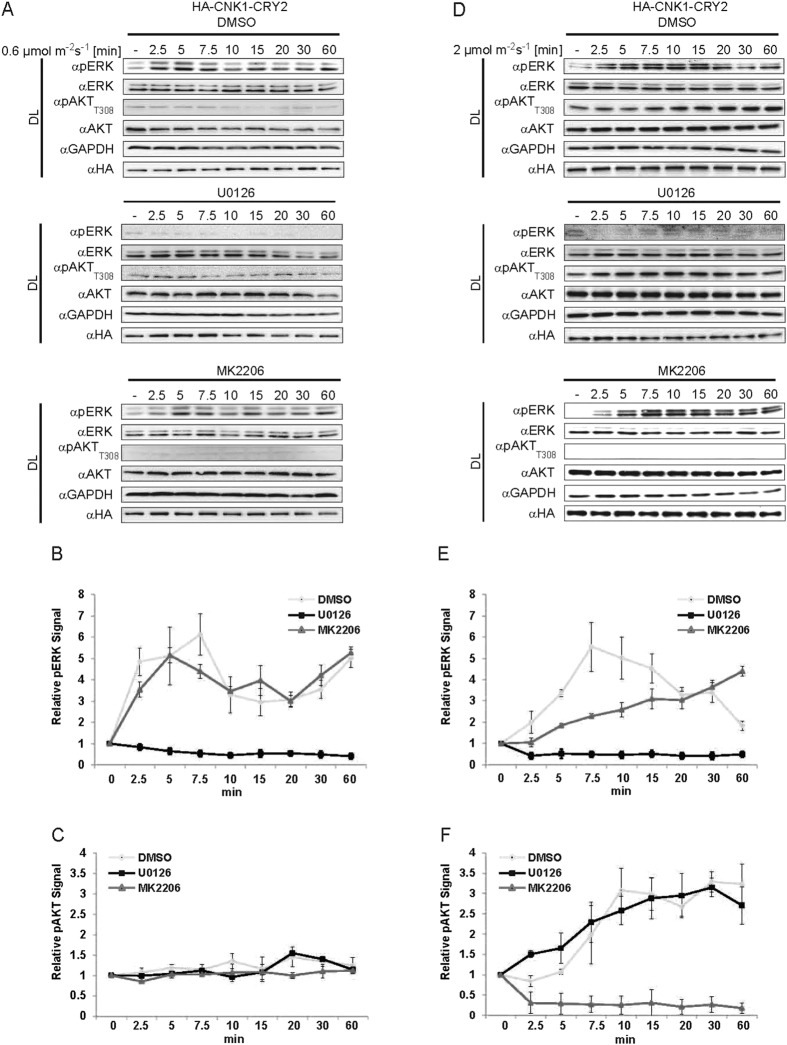
Figure 2. Kinetics of CNK1-CRY2 mediated ERK and AKT activation.
(A and D) HA-CNK1-CRY2 expressing HEK293T cells were treated with DMSO (upper panels), U0126 (middle panels) or MK2206 (lower panel) and illuminated with 0.6 μE m−2 s−1 of 460 nm (A) and 2 μE m−2 s−1 (D) for the time points indicated. Immunoblots show that the kinetics of ERK and AKT phosphorylation depend on the light intensity used for activation of HA-CNK1-CRY2. (B,C) and (E,F) Quantification of immunoblot data shown in (A) and (D). N = 3, mean + SEM.

