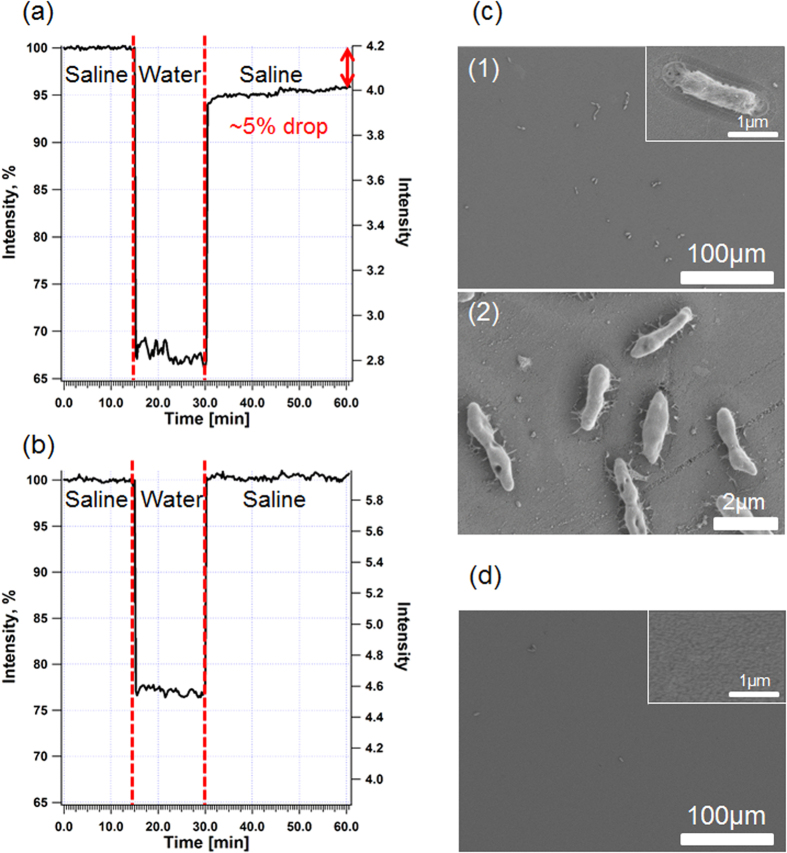
Figure 5. Representative biosensing experiments (left) and the corresponding HRSEM images (right) of the biosensors immediately after the experiments.
(a) Spiked process water (104 cell/mL E. coli). (b) Control - original process water (no E. coli). (c) The corresponding HRSEM images (in two different magnifications) of the biosensor after a biosensing experiment with spiked process water, demonstrating bacteria capture. The inset presents enlargement of a captured bacterium on the biosensor surface. (d) A corresponding HRSEM image of the biosensor after the control experiment (original process water, no E. coli) showing a negligible amount of cells. The inset presents enlargement of the biosensor surface.

