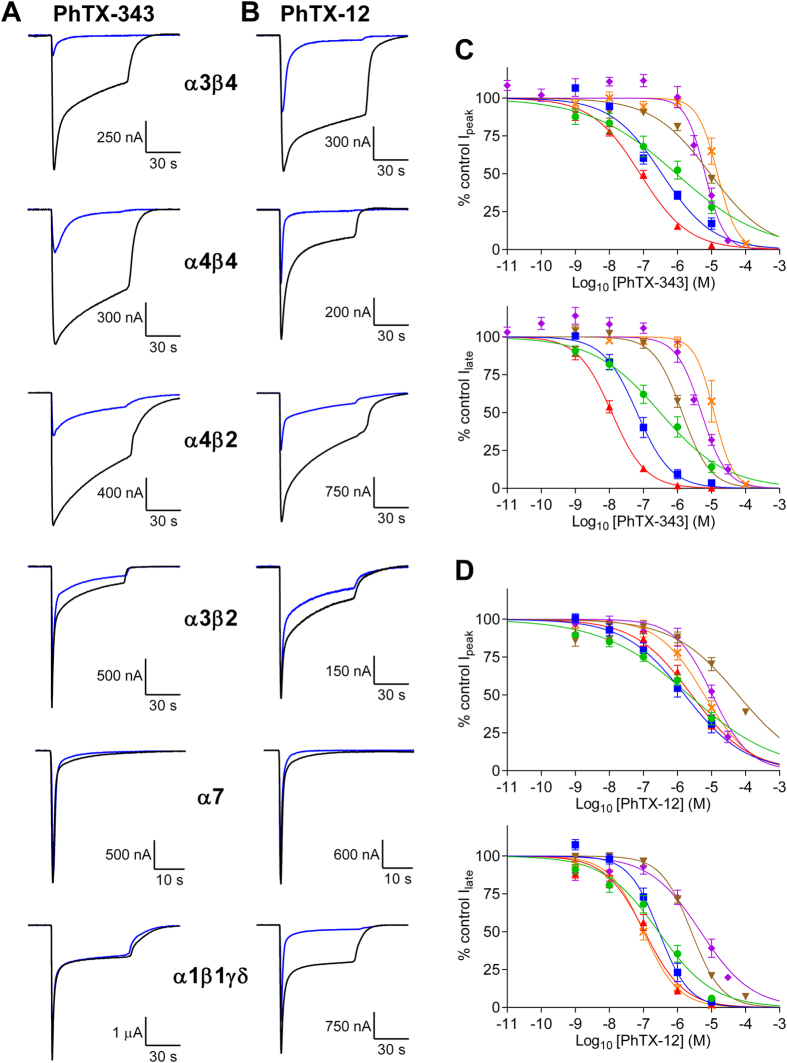
Figure 2.
(A,B) Responses to ACh in the absence (black) or presence (blue) of 1 μM PhTX-343 (A) or PhTX-12 (B) for all of the tested nAChR subtypes. (C,D) Concentration-inhibition curves for PhTX-343 (C) and PhTX-12 (D) inhibition of α3β4 (red ▲), α4β4 (blue ■), α4β2 (green ●), α3β2 (brown ▼), α7 (purple ♦) and α1β1γδ (orange ×) peak (upper) and late (lower) current. The ACh concentrations were 10 μM for α4β4, α4β2 and α1β1γδ, 30 μM for α3β2, and 100 μM for α3β4 and α7. VH = −80 mV. Curves are fitted by Eq. 1 and IC50 values are given in Tables 1 and 2. There is a noticeably greater left-right spread of curves for PhTX-343 and a leftward shift for late current inhibition curves as compared to peak current inhibition for both toxins.

