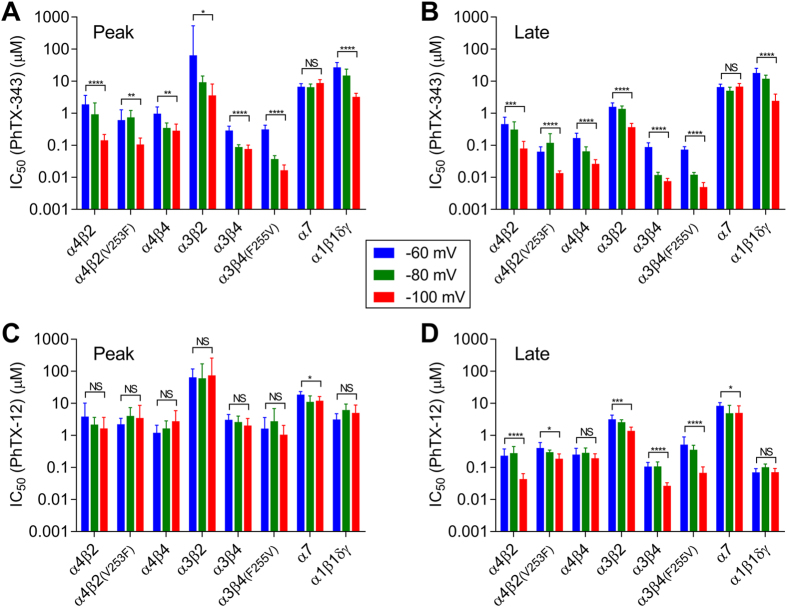
Figure 5.
Voltage dependence of inhibition of nAChRs by PhTX-343 (A,B) and PhTX-12 (C,D) for peak (A,C) and late (B,D) current. The bars show IC50 (μM) at VH of −60, −80 and −100 mV. *(p < 0.05), **(p < 0.01), ***(p < 0.001) and ***(p < 0.0001) indicate significant differences in the IC50 values for −60 and −100 mV (NS = not significantly different; p > 0.05).

