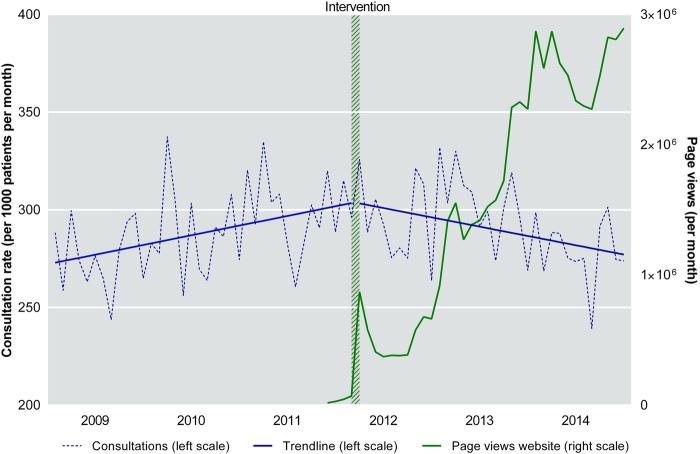
Figure 1.
Rate of primary care consultations and page views of the website. Consultation rates with trend lines are displayed on the left y-axis. The number of page views of the website is displayed on the right y-axis and shows a steep increase in March 2012, which represents the launch of the website.

