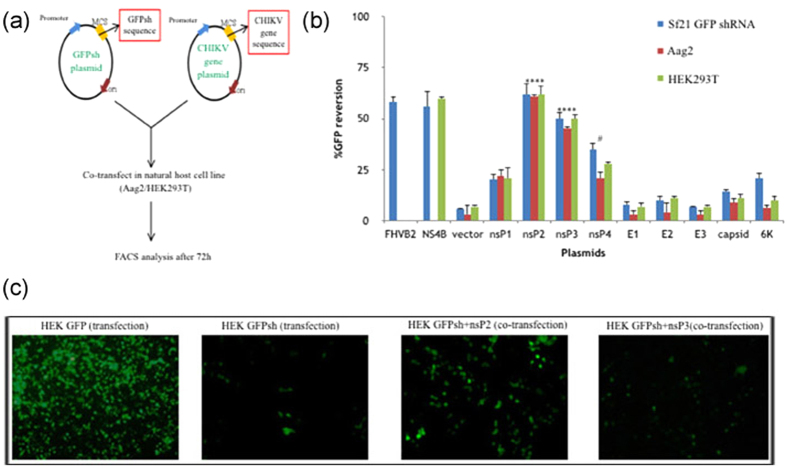
Figure 2. Validation of RNAi suppressor activity in natural host cell lines.
(a) Workflow of transient transfections in natural host cell lines (Aag2 and HEK293T). The cells were co-transfected with host specific GFPshRNA plasmid and CHIKV gene plasmid. GFP based FACS analysis was done after 72 h. (b) Graphical representation of % GFP reversion (Mean ± SD) in different cell lines, namely Sf21 GFPshRNA, Aag2 and HEK293T. Previously published VSRs FHVB2 (flock house virus) and NS4B (dengue virus) were taken as positive controls and empty vector was used as negative control. Statistical significance was analysed using student’s t-test and Fisher’s Least Significant Difference (LSD) test using empty vector as control. The *symbol indicates a statistically significant difference in terms of the P value (P < 0.001) and #symbol represents p-value > 0.001. nsP2 (p-value = 0.0003) and nsP3 (p-value = 0.0007) were found statistically highly significant, while nsP4 was found not significant (p-value = 0.035) (Alpha level of the test = 0.05). (c) Fluorescent microscopic images of HEK293T cell line based assay. HEK293T cells were transfected with GFP plasmid and GFPshRNA plasmid in separate wells. For GFP reversion assay GFPshRNA and individual VSR plasmid were co-transfected and cells were checked for fluorescence under microscope at 72 h post transfection.

