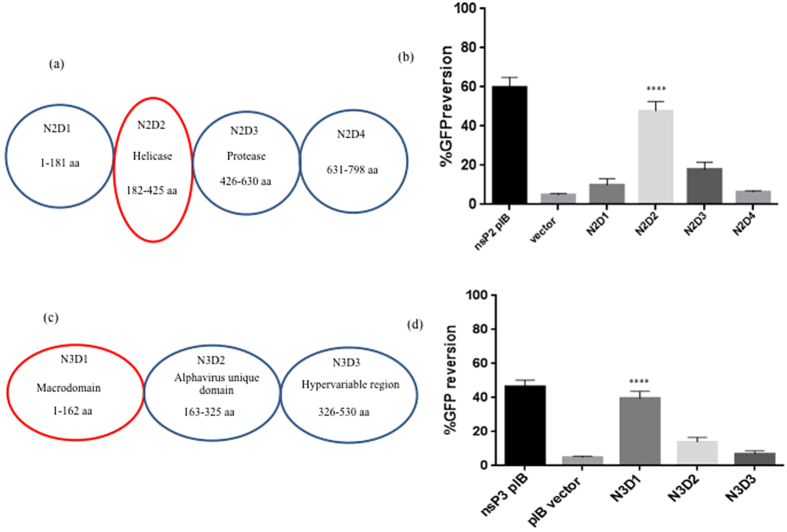
Figure 5. Domain mapping of VSR activity.
(a and c) Schematic representation of different domains of nsP2 (N2D1, N2D2, N2D3 and N2D4) and nsP3 (N3D1, N3D2 and N3D3).(b and d) Graphical representation of Mean ± SD of FACS data for GFP reversion in individual domains of VSRs. The domains were separately cloned in pIB/V5-His TOPO vector and transfected in Sf21 sensor cell line. GFP based FACS analysis was done after 72 h. Percentage GFP reversion was calculated from FACS data. Statistical significance was analysed using student’s t-test and Fisher’s Least Significant Difference (LSD) test using empty vector as control. The *symbol indicates a statistically significant difference in terms of the P value (P < 0.001). nsP2 domain2 (N2D2 p-value < 0.0001) and nsP3 domain 1 (N3D1 p-value < 0.0001) were found statistically highly significant (Alpha level of the test = 0.05).

