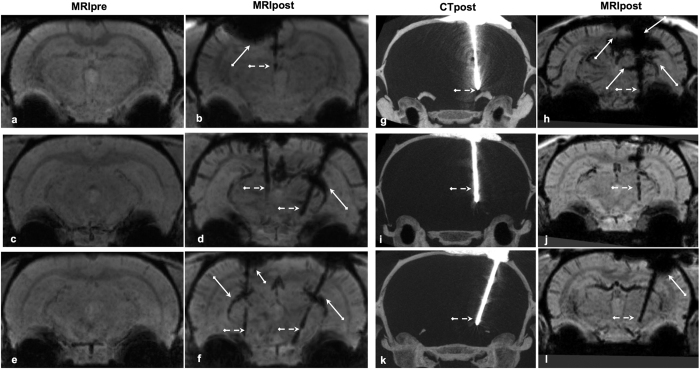
Figure 5. Surgery-related adverse effects visualized in post-operative MRI.
Representative mIPs of pre-operative (column 1) MRI, mIPs of post-operative MRI (column 2, 4) and MIPs of post-operative CT (column 3 – maximum intensity projections) generated from coronal cross-sections covering the extent of the electrode trajectory. When compared to the pre-operative MR image (a,c,e), the post-operative images (b,d,f) show specific hypo-intense contrast along the trajectory (dotted white arrows), but often also a-specific hypo-intense clusters (indicated by continuous arrows) around the cortex (near electrode entry position) or superior colliculus vessel (radial to the trajectory), which appear to be likely indications of ICH or other deleterious effects of the surgery. As expected, post-operative CT in column 3 (g,i,k) does not show soft tissue contrast from the brain as well as any signs of deleterious effects as noted in the corresponding post-operative MRI (h,j,l).

