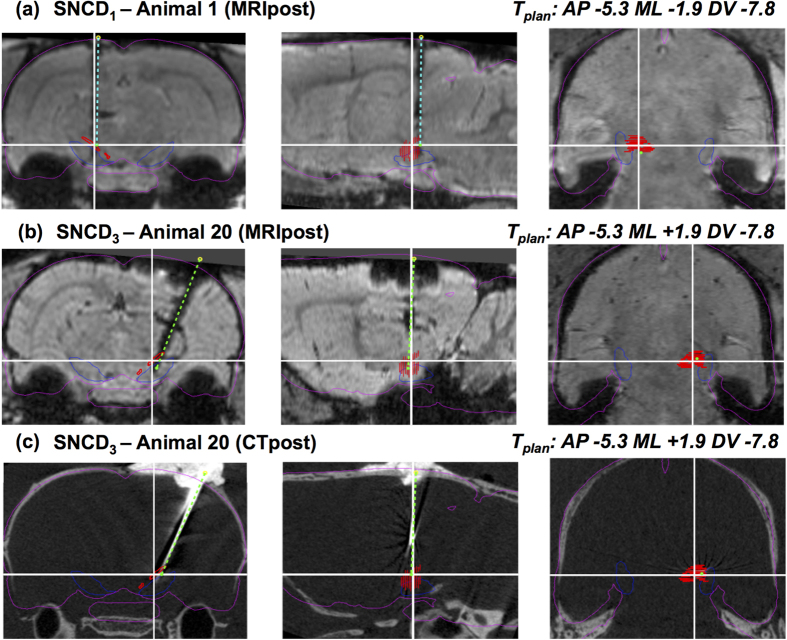
Figure 6. Reconstructed electrode trajectories from MRI and/or CT in individual animal.
(a) Three orthogonal cross-sections of the post-operative MR image of animal A1 of group SNCD1 in MRIpax space (left: coronal, middle: sagittal, right: horizontal) at the planned target location (indicated by white cross-hairs) with the MRI-based reconstruction of electrode trajectory overlaid (dashed cyan line) and its entry and tip locations marked (Erec-mri: yellow o, Trec-mri: green •). The planned trajectory in this case coincides with the vertical cross-hair in the coronal and sagittal cross-sections. Contours of brain (magenta) and substantia nigra (blue) as derived from the MRH template32 are overlaid to illustrate the spatial normalization with this atlas. The contours of the target region (SNCD in the left hemisphere) as derived from the coronal slices of the atlas from Paxinos and Watson8 are depicted in red. The electrode tip location (Trec-mri) is more posterior than planned, but falls just inside the target region in this case; (b,c) Similar visualization as in (a), but for animal A20 of group SNCD3, in which SNCD in the right hemisphere was targeted with a planned ML inclination of the trajectory (~18°), followed by both post-operative MRI (b) and post-operative CT (c); The electrode trajectory reconstructed from its trace in post-operative MRI (b) visually matches well with the one reconstructed from post-operative CT with the electrode in place (c).

