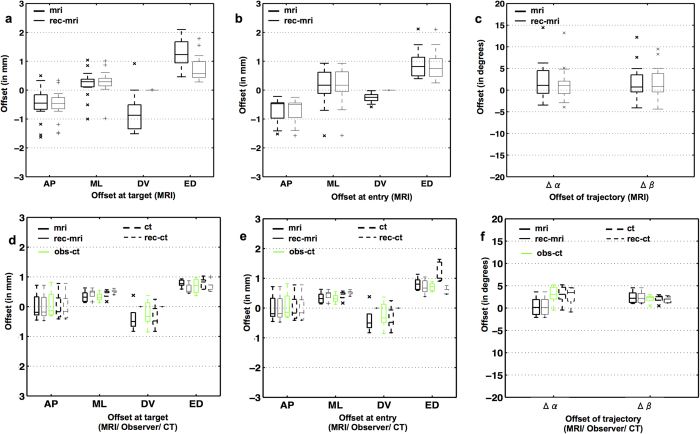
Figure 9. MRI/CT-based assessment of targeting accuracy.
(a–c) Offsets in AP, ML and DV direction and Euclidean distance (ED) (in mm) between planned and actual target (a) and entry (b) locations as derived from post-operative MRI (mri) and its 3D trajectory reconstruction (rec-mri; n = 17 trajectories from Exp.1). (c) Offset in angular inclination (in degrees) between the planned and actual trajectory along ML (α) and AP (β) directions; (d–e) Translation and angular offsets at target and entry as computed from post-operative MR image (mri) and those that were reconstructed based on MRI (rec-mri) are illustrated as boxplots with continuous lines (n = 5 trajectories from Exp.2). Similar measures computed from post-operative CT image (ct) and the reconstruction from CT image (rec-ct) are shown as boxplots in dashed lines. The measurements from a manual observer in CTpost images (obs-ct) are illustrated in green colored boxplots.

