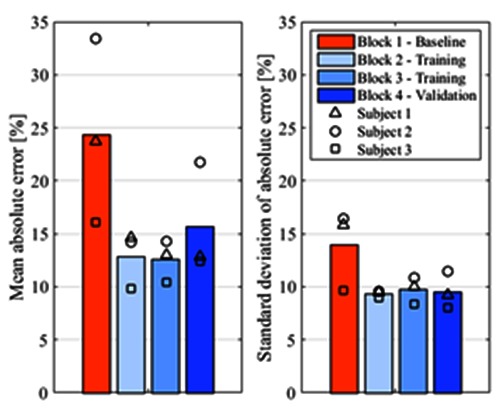
Fig 3.

Mean absolute error (left) and standard deviation of absolute error (right) for four blocks of the routine grasping task, averaged across all subjects. The results for individual subjects are marked with different symbols (Subject 1 – triangle, Subject 2 – circle, Subject 3 - square).
