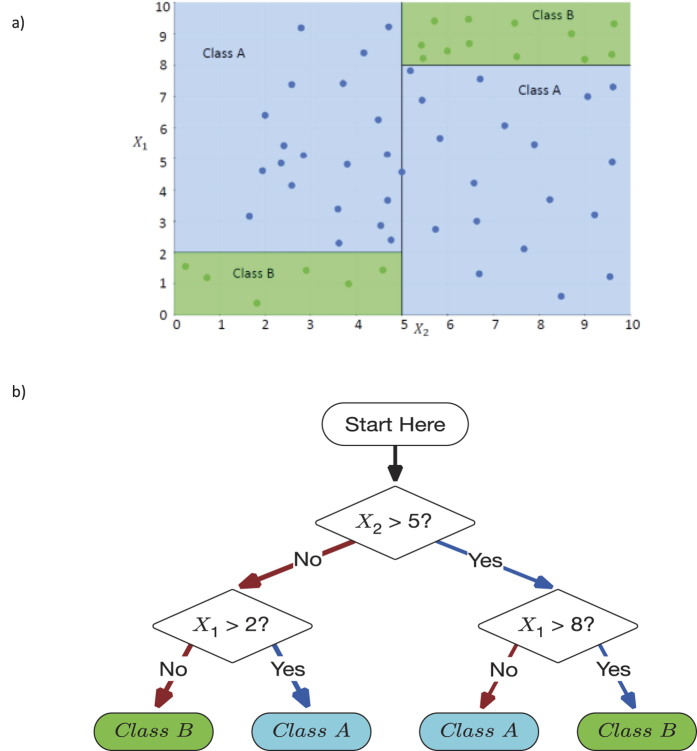
Figure 1.
An example decision tree on a toy data set, showing (a) the induced decision surface (shaded regions) and the set of 2D training data, where the color of each data instance represents its class label, and (b) the corresponding decision tree, composed of three decision nodes to partition the data into the four subregions.

