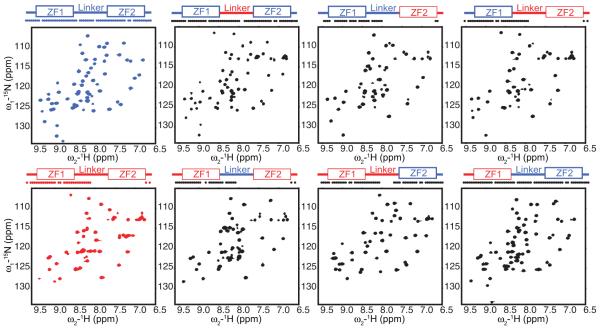
Figure 3.
The amino acid sequence of ZF2 determines the structure of ZF2. Backbone amide cross peaks represented for TTP (red), TIS11d (blue), and chimeras (black). On top, a schematic representation of the TZF domain shows the zinc fingers as rectangles and the linker as line (sequences from TIS11d and TTP shown in blue and red, respectively). The dots indicate residues along the sequence with a cross-peak in the 15N-1H HSQC spectrum.

