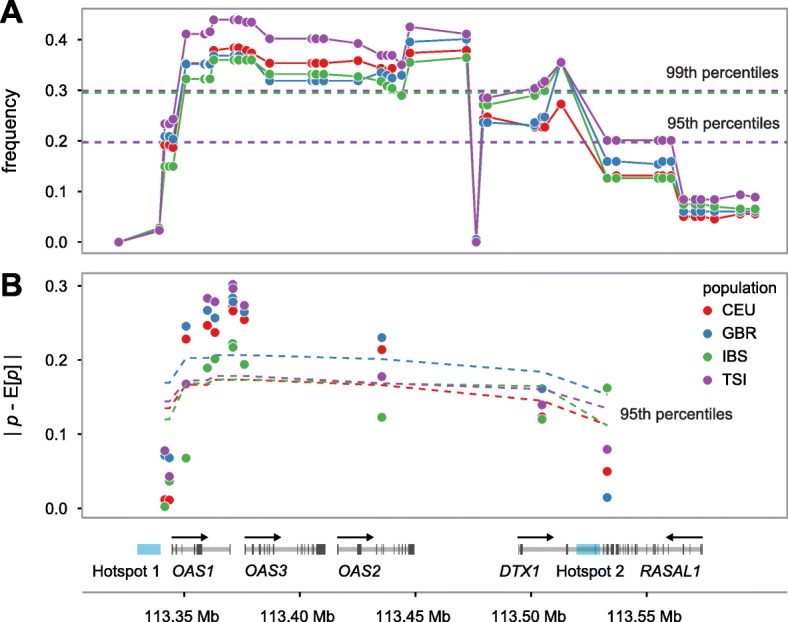
Fig. 2.

OAS-introgressed haplotypes are found at higher frequencies in European populations than expected under neutrality. a Comparison of frequency (y-axis) of NLS in the OAS locus in the CEU, GBR, IBS, and TSI European population samples with respect to neutral expectations (dashed lines) based on coalescent simulations. b Absolute difference between observed and expected allele frequency in the same four present-day European samples (y-axis) based on ancient DNA data. Dashed lines represent the 95th percentile of the expected distribution based on similar deviations calculated on a dataset of approximately 1 million SNPs scattered around the genome and with comparable present-day frequencies to those found for NLS in the OAS region
