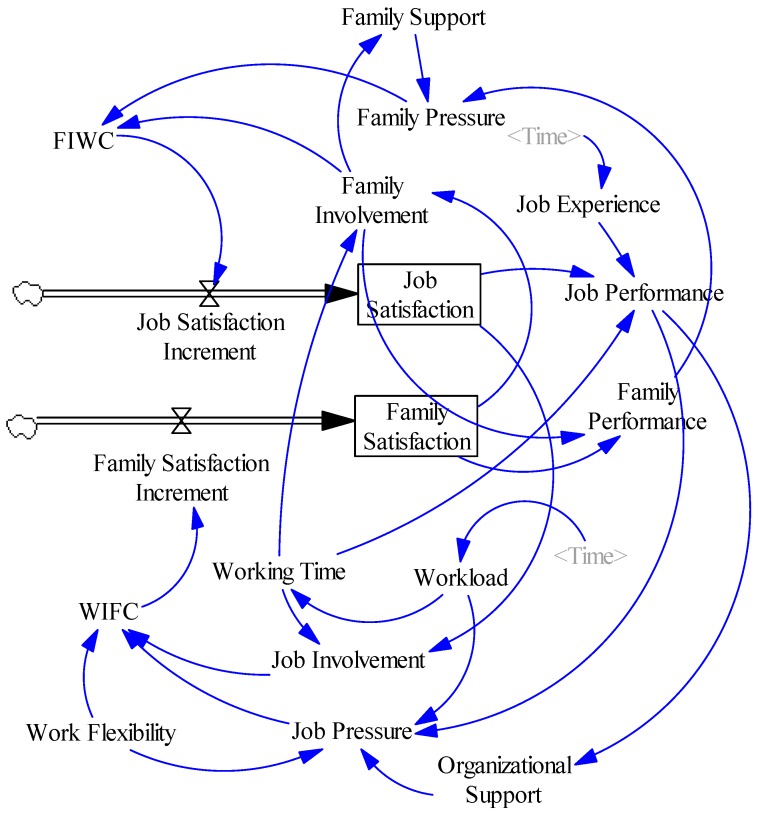
Figure 4.
System flow diagram of construction industry employee WFC evolution. The diagram is constructed by the Vensim PLE software. There are two straight arrows in the system flow diagram which are called Rate. The Rate has a single arrowhead, indicating the direction that material can flow like a pipe with a valve. However, this is only a diagram, in a simulation model, the equation governs the direction that material can flow. In this system, the two rate variables flow to the two state variables as the material under the influence of FIWC and WIFC.

