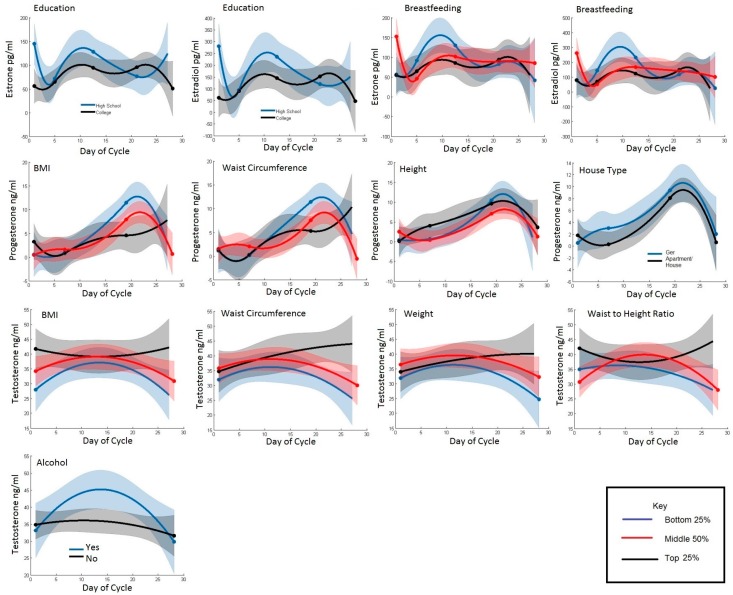
Figure 1.
T Hormones concentrations are shown over the menstrual cycle in Mongol women according to different lifestyle (education, ger and alcohol), reproductive (breastfeeding) and anthropometric (BMI, waist circumference, height, weight, waist-to-height ratio). Distributions of the risk factors are cut into the top 25% (black), the middle 50% (red), and the bottom 25% (blue). Estrone and an estradiol are shown in row 1, progesterone is shown is row 2, and testosterone is shown in rows 3 and 4.

