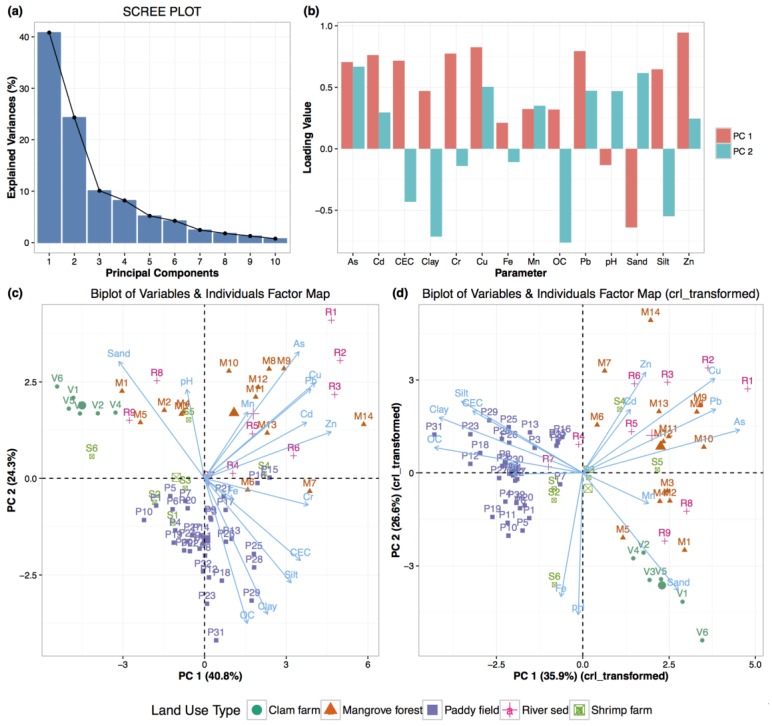
Figure 5.
Results of the principal component analysis for all heavy metals and soil properties in five land uses. (a) Scree plot for the first 10 components of untransformed data; (b) Bar graph of the loading values in the first two principal components of untransformed data; (c) The biplot for PC1 and PC2 of untransformed data; (d) The biplot for PC1 and PC2 of the centered log ratio (crl) transformed data. PC, principal component.

