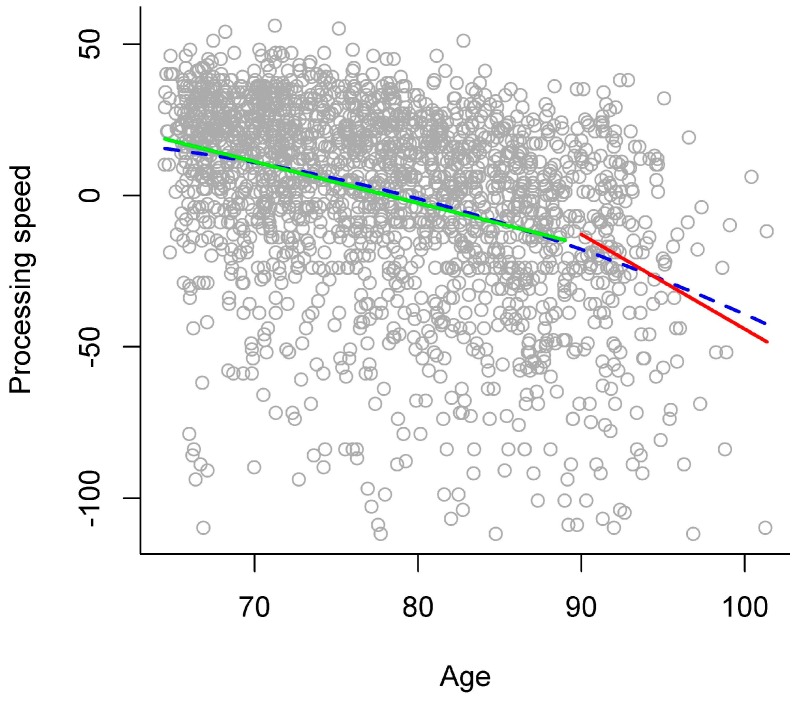
Figure 1.
Age relations in processing speed. Scores in processing speed plotted against chronological age, with different models of age relations: gradual model (blue dashed line) and stage model (young-old adults: green solid line, versus old-old adults: red solid line). Note that to achieve that higher values represented better performance across all variables, the distribution of latency scores was reversed. Individuals with negative values were slower than the mean.

