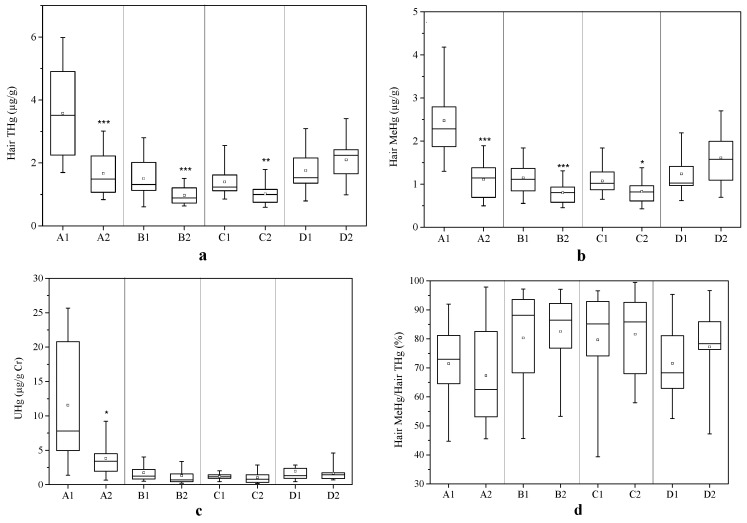
Figure 3.
Hair THg (a) and MeHg (b) concentrations; UHg (c), and the proportion of THg as MeHg in hair (d) in children of the Wanshan Hg mining area. Each box represents the interquartile range (25th and 75th percentile), the band near the middle of the box is the 50th percentile (the median), and the whisker represents 5th and 95th percentile (*** p < 0.001, ** p < 0.01 and * p < 0.05 compared with the sampling site in the same region, independent t-test).

