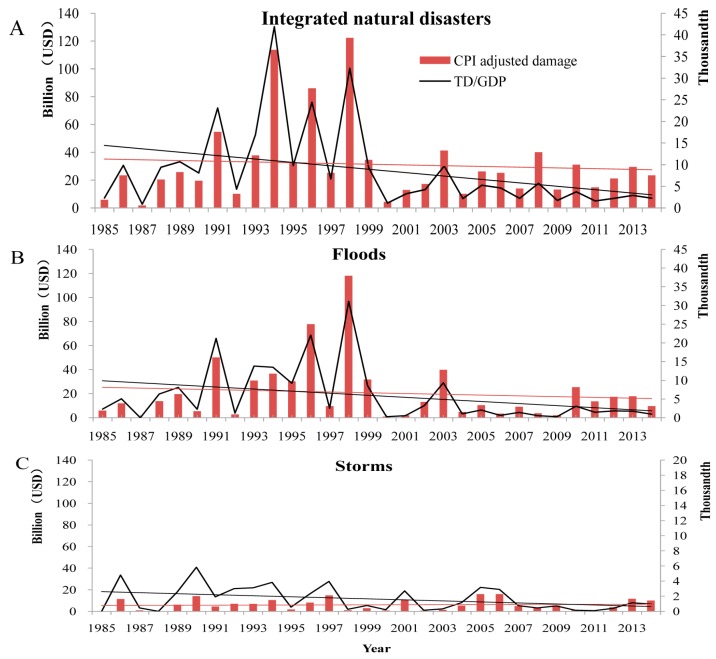
Figure 7.
Economic losses caused by integrated natural disasters, floods, and storms in China, 1985–2014. (A) Integrated natural disasters; (B) flood; and (C) storms. Note: The y-axes on the left correspond to the index of “CPI-adjusted damage”; the y-axes on the right correspond to the indexes of “TD/GDP”; the line in red represents the changing trend of CPI-adjusted damage, while the line in black represents that of TD/GDP.

