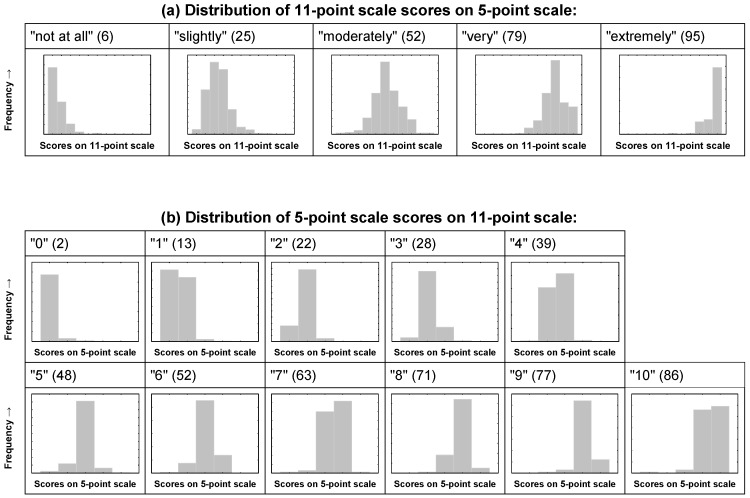
Figure 2.
Distribution of annoyance score values. (a) Distributions of absolute frequencies of the annoyance score on the 11-point scale for each answer (“not at all”, “slightly”, “moderately”, “very” and “extremely”) on the 5-point scale; (b) Distributions of absolute frequencies of the annoyance score on the 5-point scale for each score on the 11-point scale. The figures in brackets represent the mean score (discrete conversion value) on the respective other scale, rounded to the nearest integer.

