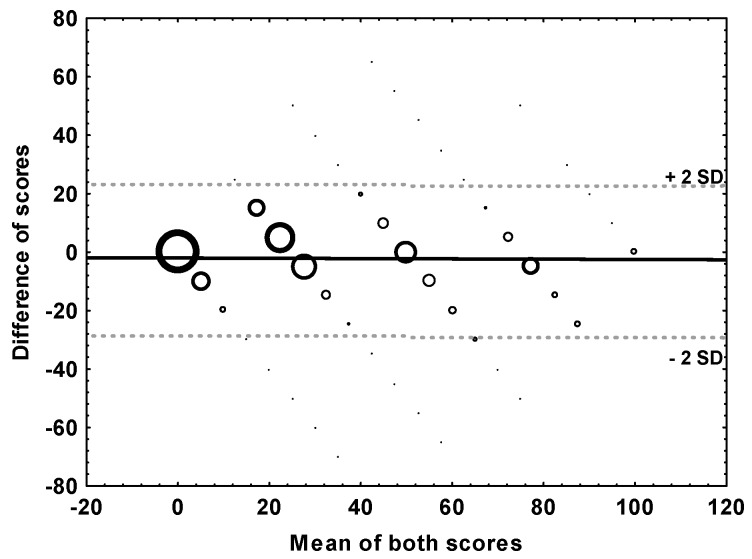
Figure 3.
Bland-Altman bubble plot of the difference of the annoyance score (mean difference = −2.6, solid line), versus their mean including limits of agreement, as indicated by ±2 standard deviations (SDs) of the difference (dashed lines). Note: Bubble size is proportional to the frequency of responses having the particular combination of mean and difference; N = 2378.

