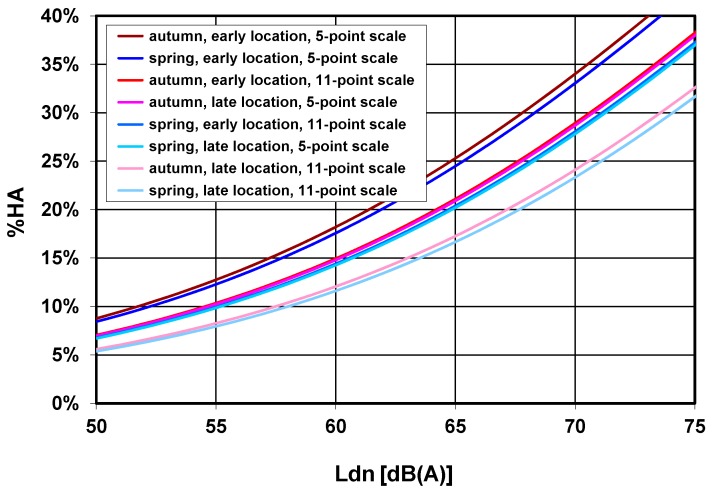
Figure 6.
Percentage highly annoyed (%HA, using a 40% (5-point scale) and 28% (11-point scale) cutoff point, respectively) as a function of Ldn and various factor combinations, based on coefficients of the logistic model in Table 7. The factors “Sequence of annoyance question” and ”Order of response alternatives” were kept constant in the plot and set to “5-point → 11-point” and “ascending” respectively. Note: for better readability, the series order matches the level of %HA.

