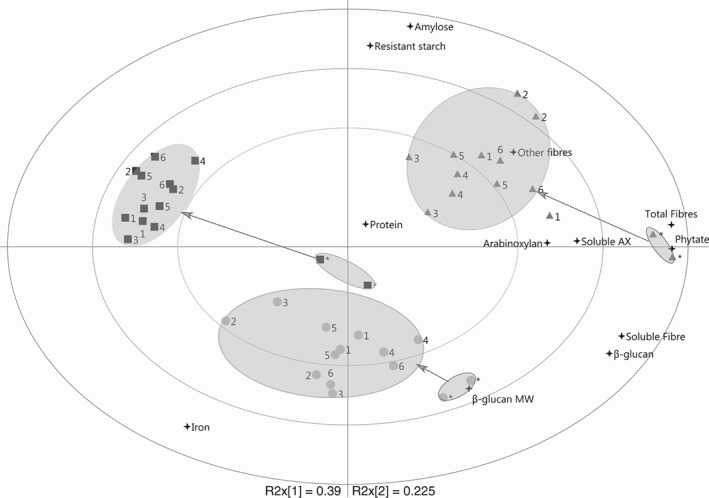
Figure 2.

Bi‐plot of PCA based on the chemical characterization of untreated barley and barley malt. The positions for untreated (*) samples and each steeping condition (for details see Table 1) are shown and related to the chemical characteristics measured ( ).Data points belonging to the same group are within the marked areas. The data are grouped according to the barley variety (Tipple
  , Karmosé
  , Cinnamon
  ). The arrows show the change in chemical characteristics from untreated material to malt of each barley variety.
