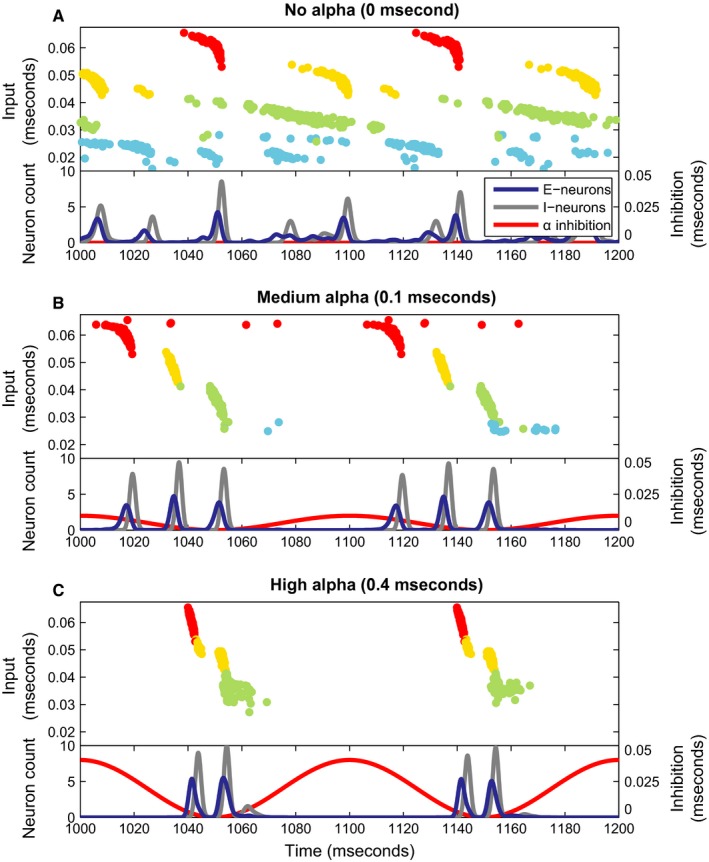
Figure 3.

Simulations for different levels of the inhibitory alpha drive. (A–C) The figures show a raster plot of the activity of the excitatory neurons in the network. The neurons are sorted along the y‐axis according to the strength of the excitatory input they receive. Secondly, they are colour‐coded based on which ‘spotlight’ they belong to, see Figs 2B and S1 (Supporting Information). Below each raster plot, a pseudo‐spiking histogram for the excitatory and inhibitory neurons is plotted (the spiking histograms are convolved with a Gaussian kernel, giving a smoother representation of network activity), together with an overlay depicting the sinusoidal alpha inhibition projecting to the excitatory neurons similar to Fig. 1C.
