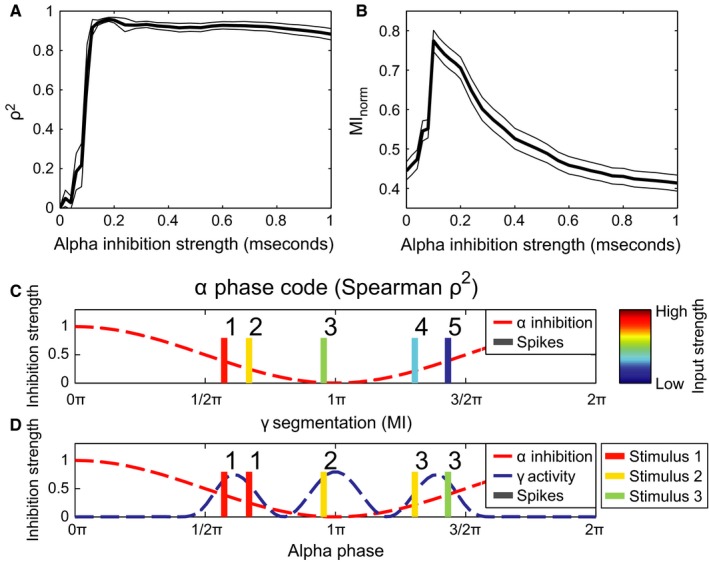
Figure 5.

The performance in terms of the phase‐organized code as a function of alpha strength. (A) Phase coding quantified by calculating the square of Spearman's correlation coefficient (ρ2) between firing phase and input level (see C). The thin black lines indicate the SE, multiplied by a factor 10 to make them visible, as estimated by 1000‐fold bootstrapping. (B) Phase coding quantified by means of mutual information between stimulus index of the neuron and index of the gamma cycle the neuron fires in (see D). As in (A), the thin black curves indicate ten times the SE as estimated by 1000‐fold bootstrapping. (C) Schematic illustration of using Spearman's ρ (panel A) to assess coding performance. Colour of action potentials indicate excitation level (red is high, blue is low) which is then correlated with the ranked firing phase (illustrated by the numbers 1–5). (D) Schematic illustration of how gamma segmentation performance was measured (panel B). All neurons are either classified by which gamma cycle it fires in (indicated by the numbers 1–3 above the spikes), or by the stimulus it belongs to. The stimulus classification had five different classes: four classes indicating by which of the four circular stimuli the neuron was stimulated and one class when a neuron received no excitatory stimulation at all (indicated by the colour, see Fig. 2B and legend to the right). The mutual information is then calculated between these two classifications.
