
Figure 2.
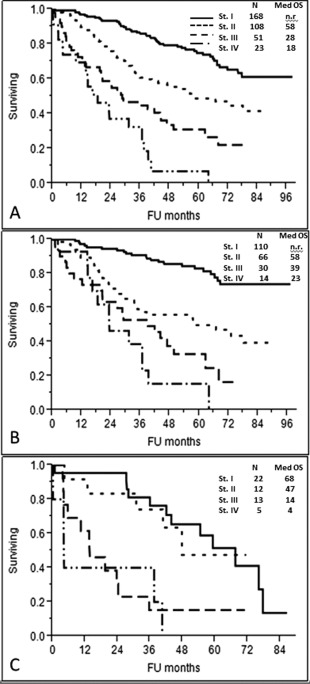
Kaplan–Meier curve for overall survival according to the frailty system based on Age ≥70, ECOG‐PS ≥2, and NT‐proBNP ≥300 ng/L (P < 0.0001) [different stages based on a score of 0 to 3 points, respectively]. A. Overall survival according to the frailty system in the entire cohort (P < 0.0001). B. Overall survival according to the frailty system in 220 patients with standard risk FISH (no high‐risk chromosome abnormalities), (P < 0.0001). C. Overall survival according to the frailty system in 52 patients with high risk FISH [presence of del17p and/or translocation t(4;14) and/or translocation t(14;16)], (P < 0.0001).