
Figure 2.
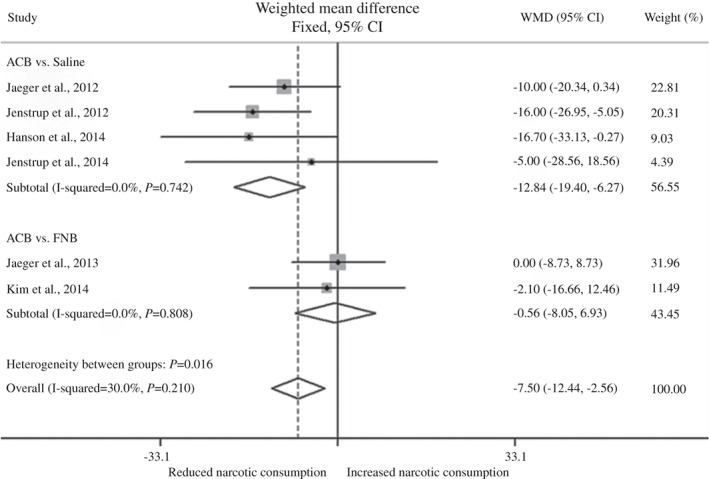
Forest plot showing relationship of different analgesic treatments with cumulative narcotic consumption after TKA. The diamonds indicate the overall effect as calculated using the weighted mean difference (WMD) in a fixed‐effect model.
Official websites use .gov
A
.gov website belongs to an official
government organization in the United States.
Secure .gov websites use HTTPS
A lock (
) or https:// means you've safely
connected to the .gov website. Share sensitive
information only on official, secure websites.
Forest plot showing relationship of different analgesic treatments with cumulative narcotic consumption after TKA. The diamonds indicate the overall effect as calculated using the weighted mean difference (WMD) in a fixed‐effect model.