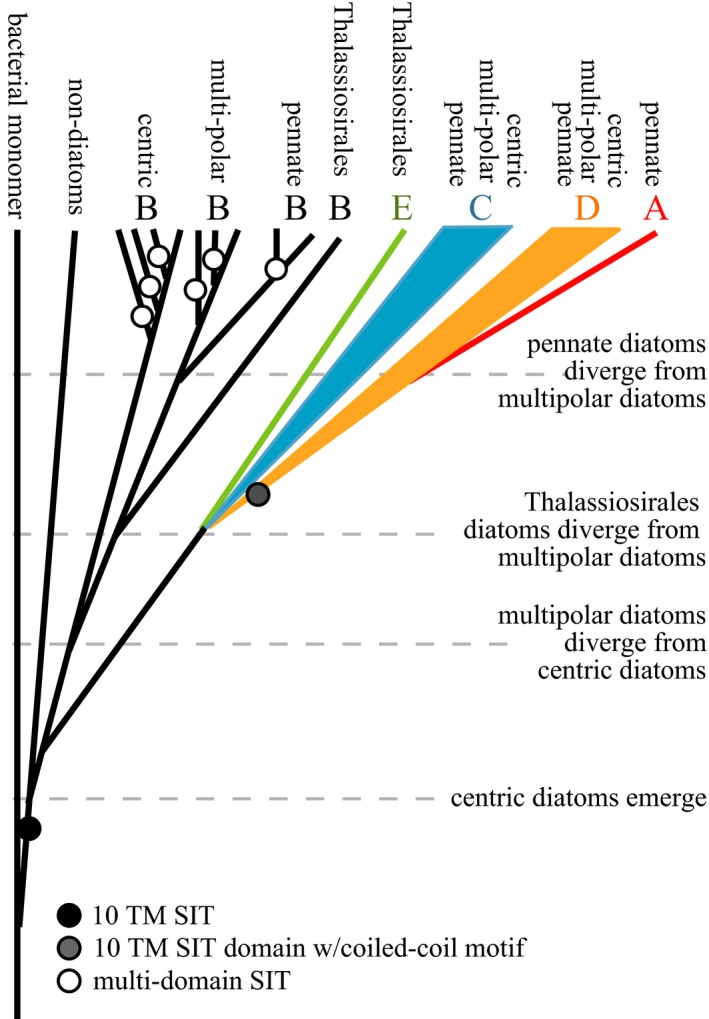
Figure 7.

Schematic of hypothesized history of SIT evolution, based on the predicted protein domains in Figure 1, phylogeny in Figure 2, and distribution of SIT clades among lineages in Figure 3. Circles at the base of a branch indicate the evolution of a new domain. The timing of the evolution of different diatom lineages is indicated by horizontal dashed lines, but is not scaled to actual time.
