
Figure 5.
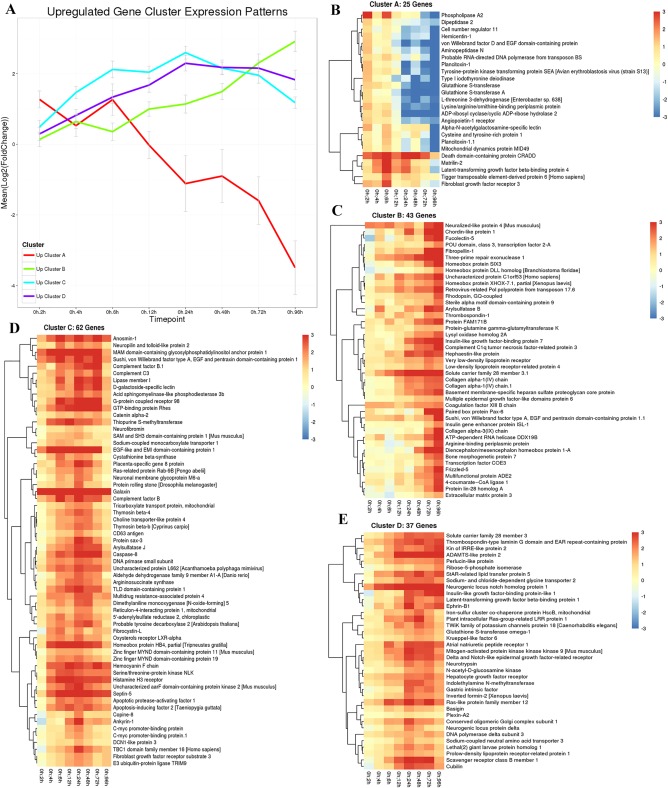
Up‐regulated gene cluster expression patterns in regenerating Ptycodera flava. A: The line graph shows all putative genes that are initially up‐regulated and cluster together in their expression profiles along all time points sampled. Red, cluster A genes; green, cluster B genes; blue, cluster C genes; and purple, cluster D genes. The X‐axis is time of regeneration and the Y‐axis is the log2 fold change in gene expression compared with control animals. B–E: Heatmaps showing the individual genes identified in clusters A, B, C, D, respectively.